2 D Maps generated using MATLAB (4/7)
2 D Maps generated using MATLAB
MATLAB’s abilities can be used for creating 2 D maps.
Color Maps
2 D color maps
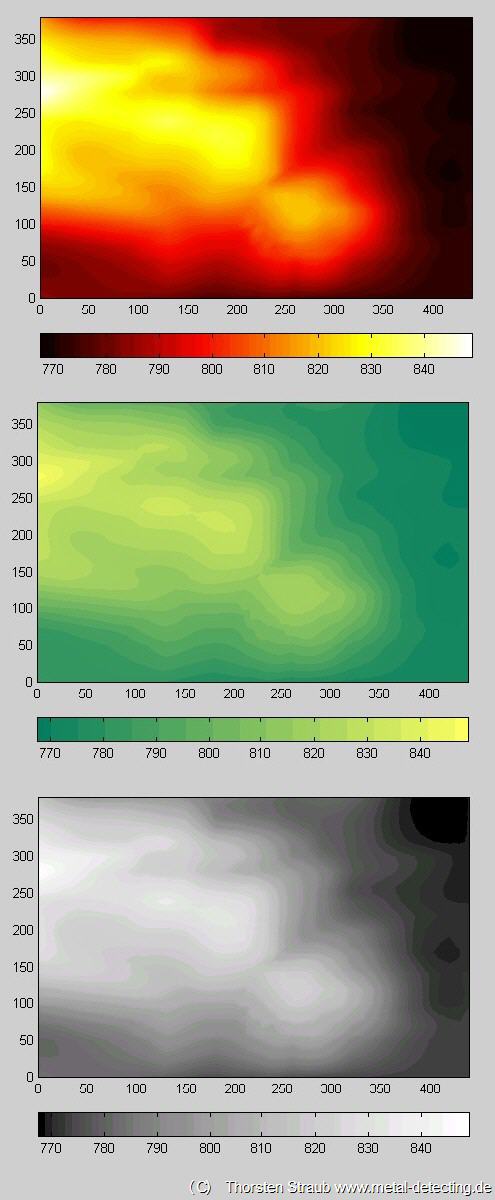
Once the hill’s shape is entered into the PC it can create all sorts of contour maps. This is useful if the official paper contour line maps are inadequate for any reason.
In these computer generated pictures various shades of color or grey represent the height information.
X and Y values are meters. The area of skull hill is some 450 m x 380 m large.
Several pictures expressing the shape of the hill by means of color and shade. They grey one can be used with colourful find symbols.
2 D contour maps
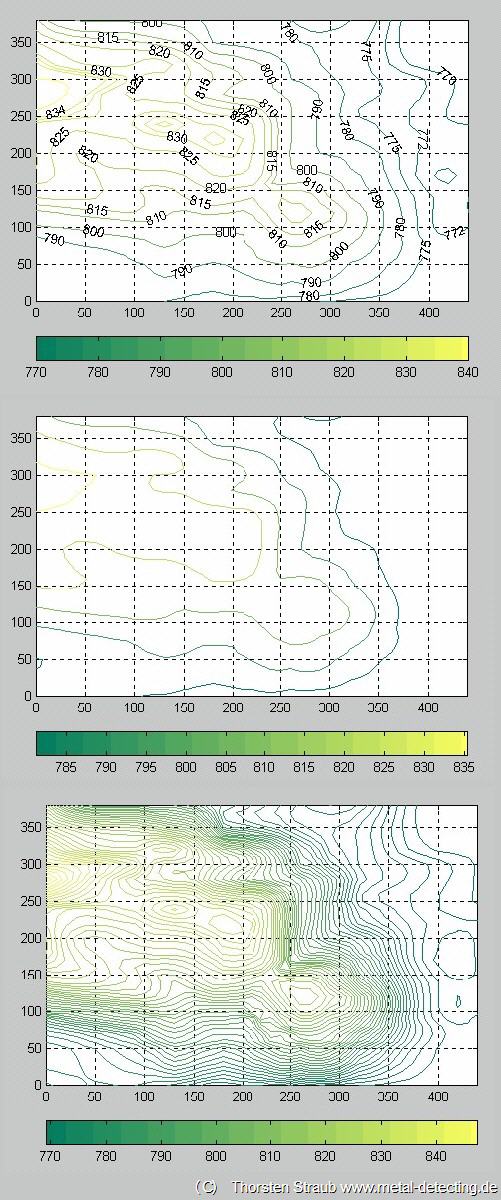
2 D contour maps
Varying the number of contour lines.
False color maps

2 D false color map steepness
Brightness indicates slope angle.
Here the color or brightness are used to express something else than height, e.g. slope angle or find probability.
This map shows the same region of skull hill. The brighter the grey the steeper the slope. Maps like that can be useful to see whether there is any connection between find density and slope angle.
An important sort of false color maps are probability maps.
I don’t have a picture at hand. The idea is as follows. Relic hunters need to find promising areas. If the connection between find probability and geographical coordinates can be expressed in a mathematical way you can use the computer to create a probability map. On this map promising areas are marked in a different color than the not so promising ones.
For example, you are searching a battlefield for cannon balls. If you know where the cannons once stood and if you know the firing range you can localize the most promising area. This is no problem with just one cannon. But the more cannons are involved the more beneficial a computer based solution becomes.
Another example. In a very large forest I know there are some 350 hill graves of bronze age and celtic times. While the graves are off limits I wish to find the corresponding settlement. It must be somewhere in the vicinity of the hills. The computer can generate a probability map.
Last example. One of the most successful treasures hunts of all times was the salvage of the wreck of the Central America. This vessel carried a lot of gold from the Californian gold fields. It was found by Tommy Thompson in the 1990s. H e created a probability map first. It was based e.g. on last known position, wind, and currents.
(C) Thorsten Straub www.metal-detecting.de 2006-2019.